There will be destinations on a PAT network which attract a large number of passengers, examples are sports and entertainment venues, rail terminals, airports and major retail sites. A PAT guideway can carry a large number of passengers and is space-efficient. But how much space is needed for a station capable of handling large flow of passengers?
I have used simple models using spreadsheets to compare the behaviour of a number of different berthing configurations .
I used a radically simplified representations of how vehicles move through a station using spreadsheets. Movements are quantised in units of length, B, equal to the spacing of berths, and units of time, T, equal to the time taken for a vehicle to move one berth length. I used low values of velocity,V; typically 2 m/s, and ignored headways.
Only boarding stations were modelled. This is because a mix of boarding and alighting would have been too complicated for the rather unsophisticated modelling technique. Boarding generally takes longer than alighting, so fewer berths would be able to handle a particular flow of alighting than would be needed for the same flow of boardings. It is also probable that stations in situations with the highest passenger flow will be for one direction in one location, such as in airports, or where the highest flows are tidal, such as sports venues and commuting destinations.
The conclusions assume that there is an ample flow of empty vehicles coming into the station complex, and so represent the bottleneck presented by the station itself.
The track is represented as a series of linked cells in the spreadsheet with the presence of a vehicle represented by a logical TRUE. The cells are linked by logic functions so that the position of a moving vehicle is represented by a phased propagation of the logical state of the cells for each iteration.
The passenger boarding times are random with a Weibull distribution. The passenger mix and the process of fitting the Weibull parameters is discussed here.
Each model was iterated 1000 times with a range of berths configurations and user mixes and the number of boardings per hr per berth was recorded. In each case the supply of empty vehicles was unlimited, so that the comparison was of the intrinsic limitations of the berthing arrangement only.
The complete list of models on this page and the next are:
| Model name | Features |
Stations where vehicles go forwards only |
|
| Sequential | Vehicles leave the rank in the same order that they enter. |
| Parking | Like cars parking at the side of a street. Arrive and leave in any order |
| Parking with Wait | The same but with a position to wait until each berth becomes free |
Stations where the vehicles can go backwards |
|
| Backout | Vehicles back out of berth but there is no individual wait position. Probably closest to proposed ULTra configuration. |
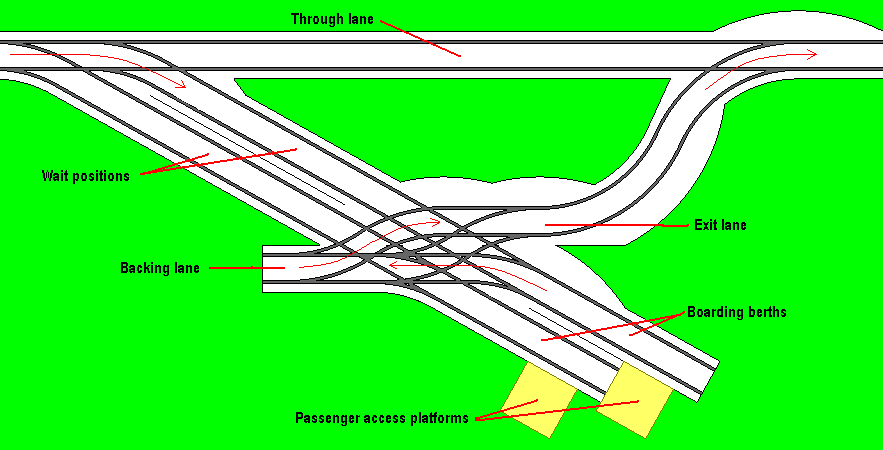
| Wait-Backin | The vehicles back into the berth from a wait position |
| Wait-Backout | The same lane is used for backing and exit |
| Wait-Backout-Exit_ lane | Vehicles back out of the berth and have a separate lane to exit |
Stations where vehicles move between two levels Discussed on a separate page |
|
| Lower & Sideways | Vehicles are lowered to grade from an elevated guideway. A number of berths in series |
| Check out | Vehicles are lowered to grade or come down ramps. Single berths in parallel |
| Lower Cabin | A MAIT Cabin is lowered to grade leaving the carrier on the elevated guideway |
Note: These spreadsheet models can be run with a set of macros which are contained in a separate spreadsheet Iterate_macros.xls which can be downloaded
I have found running the same macros on different sheets rather confusing. Some of the macros call other ones. It seemed difficult to control what was calling what where. The route to sanity seems to be to keep them all in Iterate_macros.xls. This needs to be open at the same time as the model with the name unchanged. This allows the user to rename the model spreadsheet without losing the links to the macros.
In sequential berthing the vehicles are constrained to leave in the same order as they arrive. This means that, in a multi-berth station, a passenger taking a long time to board will hold up the vehicles behind.
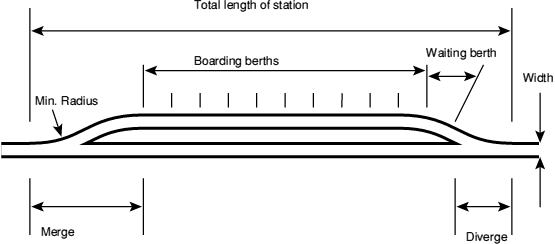
The throughput of this berthing arrangement is limited by the fact that
the vehicles have to leave the rank in the same order that they arrive.
They tend to leave as a group with an effective boarding times equal to
the longest delay in the group. Also the new set of empty vehicles
usually have to move in at least the number of spaces in the rank. It
helps to have a empty vehicles waiting just before the boarding berths.
One can be accommodated on the curve, but providing spaces for more
than this will make the whole station longer and is counter productive.
Note also that there are three ranks of sequential berths in series. We
noted that the majority of incoming empty vehicles by-pass a single
sequential berth but are used by the following ranks.
This is named to reflect a regime that is similar to parking cars in a street. The berths can be by-passed and the vehicles can leave when they are ready, but there will be congestion in the access lane.

Berths can be made inactive as in the sequential model. Running the
model with different numbers of berths demonstrated that the efficiency
of berth use fell off sharply with more than 7 berths. It seems that
this type of berthing is inefficient compared with all the others
considered and, in particular, with the parking-with-wait solutions. It
does not seem worth including in the comparison section.
Using the models it became clear that the conventional Parking-type berth, were not very efficient both because the berth could not usually be refilled quickly and congestion tended to delay departure. The following diagram shows how a wait position can be included, with a space for vehicles to weave in between the waiting position and the berth
The simulation indicates that this configuration will work with 8
berths without congestion in the passing lane. The next figure shows
the full eight berths at the same scale as the other similar figures.
However the individual platforms are rather spaced out at 8 m.
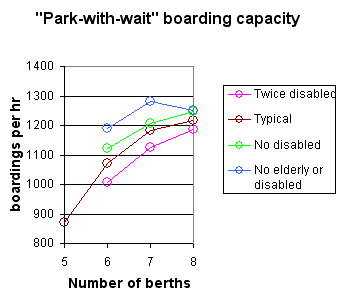
This maybe the closest to the system to be used by ULTra
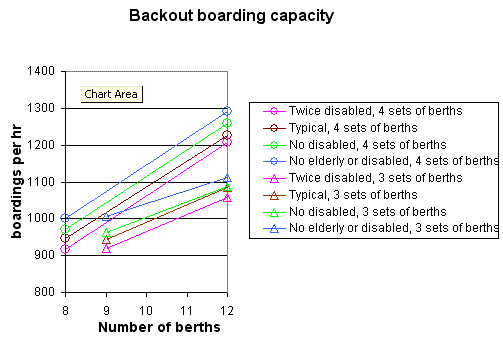
This configuration is the best in that can cope with the target passenger flow with a single rank of 12 berths


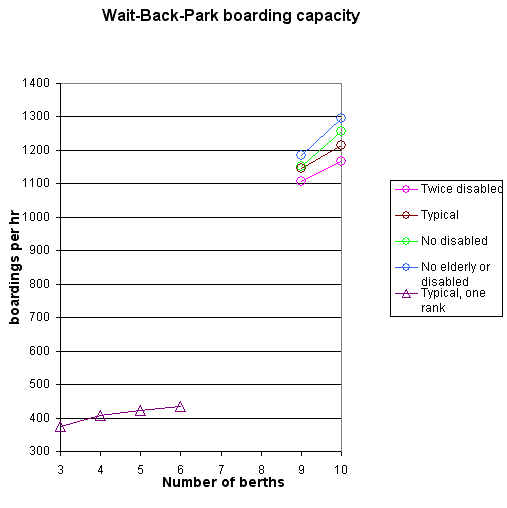
This is not so good. The congestion of the vehicles backing and exiting means that the throughput of a single rank saturates above 4 berths

 The points
are for two ranks of 3, 4 and 5 berths.

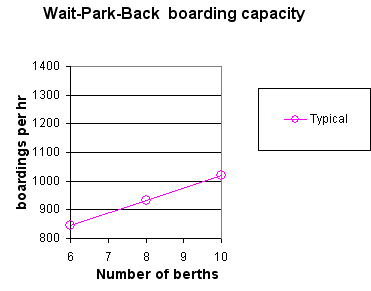
This is a bit more compact. The number of berths in each section is
limited by congestion in the central through route. Three ranks of
three gave a throughput less than the arbitrary target of 1200 vehicles
per hour. The best position for a single extra berth was in the third
rank. The results shown below for 10 berths are for this configuration
and, for 9 berths, 3 ranks of 3. The results for a single rank are
included to illustrate how the throughput of the rank levels out with
little improvement beyond 4 berths.
