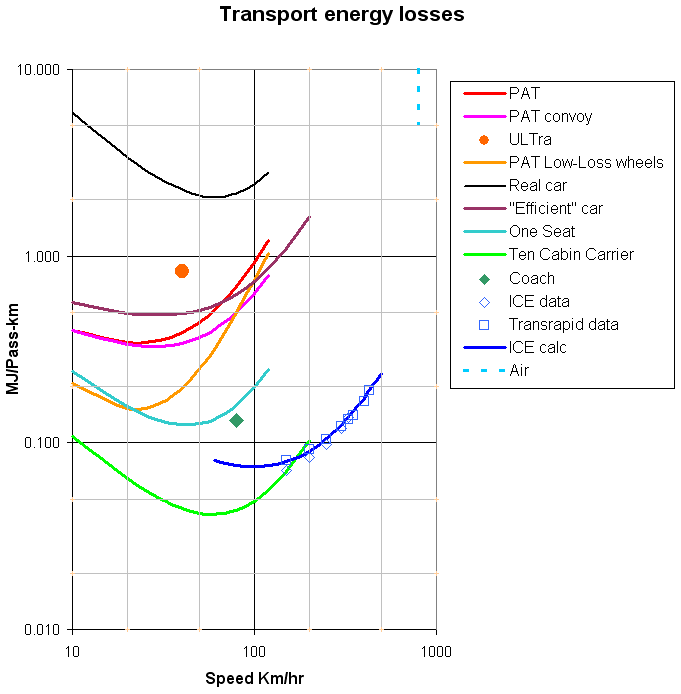
Comparison of energy losses for various modes of transport as a function of speed. The vertical scale is MJ per Passenger-km, ie, the amount of energy needed to move one one passenger one kilometer. The horizontal scale is speed in km per hour.
Not taken into account are the energy consumed in the manufacture of the vehicles and infrastructure and energy supply efficiencies. (The scope for improving supply efficiency is not clear but broadly applicable to all the different modes.)
A arbitrary constant energy consumption of 0.5 kW per passenger has been included to allow for heating, lighting and for systems standby requirements.
The drag coefficients are from wind tunnel tests using models based on the ULTra vehicle.
The rolling resistance coefficient is 0·02, typical for a rubber road tyre.
All the PAT and car curves assume 1.2 passengers per vehicle.
This is the published figure for ULTra.
A PAT vehicle the same as above but with low-loss elastomer tyres with a rolling resistance coefficient of 0.005.
As a reality check, data was taken from a graph of mpg vs speed for a "typical" car has been included. The curve is a fit to this data using the drag coefficient and rolling resistance of a typical saloon car, plus a constant, speed independent energy loss. By adjusting the constant energy loss and the efficiency a reasonable fit to the data was obtained.
This curve is for a hypothetical car with the same drag and rolling resistance as the real car above but with a high efficiency electric drive. Extra weight has been included to allow for batteries.
This curve, rather than that for the real car, should be used as a reference against which improved transport is judged.
A PAT vehicle with reduced drag intended to carry a single passenger. It could be used to avoid excessive drag at higher speeds.
A novel carrier with a cross-section similar to PAT. It is articulation with a minimal gap so that the outline is aerodynamically smooth. This curve is for 10 sectors with four-seat compartments and streamlined ends. See more details.
Another reality check. This point is based on a journey from London to Glasgow which is 411 miles and takes about 8·5 hours. The Neoplan Skyliner Megabus takes 91 passengers with a fuel consumption of 2·3kg of fuel per passenger for this journey
The curves for ICE and Transrapid are taken from a web site of the International Union of Railways and gives energy consumption in energy per km for a square meter of floor space. This is translated into energy per seat.
The same source gives the energy consumption for Transrapid which is very close to ICE
The data for cars and trains came from the web site of the German Airports Association, which gives comparative fuel consumption per passenger km for airliners, cars and rail. I have used a conversion factor 41 MJ per litre for aviation fuel.

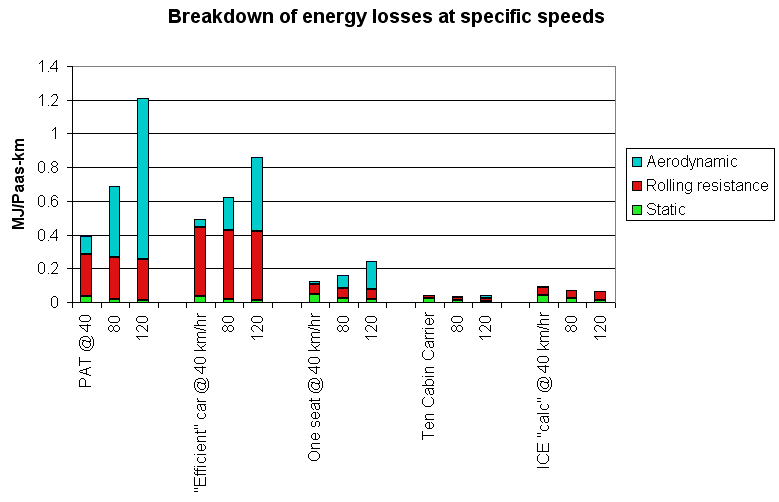
A breakdown of the types of losses using the same data and calculations as above.